

The two standard academic approaches to executive pay are optimal contracting theory, which has it roots in Jensen and Meckling’s 1976 paper on managerial behaviour and agency costs, and the managerial power hypothesis advanced by Bebchuk and Fried in 2002 in their book Pay Without Performance.
Both approaches appear to be flawed. A review of US executive compensation data covering the period 1936 to 2005 by Frydman and Saks concluded that neither agency theory nor the managerial power hypothesis was fully consistent with the available evidence.
I favour a third approach, which treats the high pay of CEOs as the result of a market failure. Efficient markets require many buyers and sellers, homogeneous products or good substitutes, plentiful information and little economic friction. The trouble with the market for CEOs is that practically none of these conditions holds good.
The market failure approach to executive pay is backed up by three further propositions.
- The remuneration committee’s dilemma. Remcos face a prisoner’s dilemma when it comes to CEO compensation. They would be happy to pay more modestly if everyone else did as well. But they reason that, if they pay over the odds, they might get a top performer. Conversely, if they pay modestly and everyone else pays over the odds, they might get an underperforming CEO. So everyone pays over the odds.
- The investors’ collective action problem. Investors face a collective action problem when it comes to executive pay. While a £3.25 million bonus paid to the CEO of a FTSE100 company might seem a lot of money, to a large investment management firm with £50 billion of assets under management in the UK, holding 1% of the company’s shares, the amount involved is relatively trivial. It only makes sense if investors act together.
- The LTIP valuation issue. There is a problem with the subjectively perceived value of LTIPs. If you offer an executive £100,000 in cash or a share-based performance-related financial instrument with an economic value of £300,000, don’t be surprised if he or she would prefer to take the cash. By the time they have applied subjective probability-based discounts for uncertainty and complexity of around 18% and time discounts in excess of 30% per annum, the psychological value which the executive attaches to the shares maybe as little as 28% of their economic value. A consequence of paying people in a currency they don’t fully value is that they want more to compensate for the subjective discount. Thus it seems entirely reasonable to conjecture that remcos will increase the size of LTIP awards to make up for for the perceived loss of value compared with less risky, simpler, and more immediate forms of reward.
The data on CEO earnings
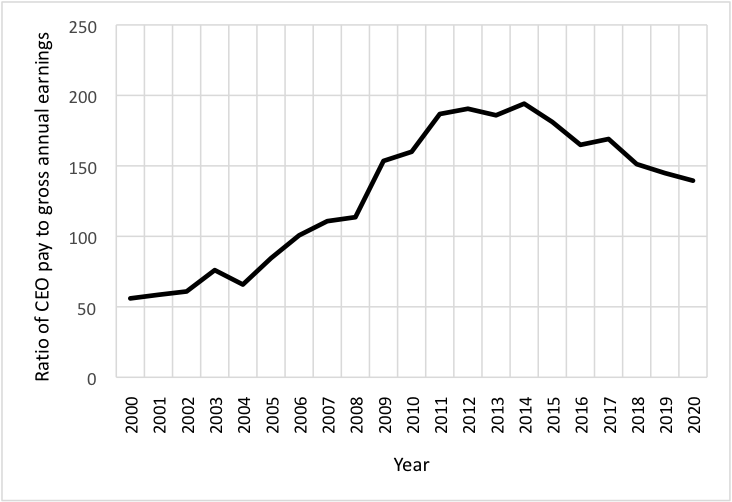
I have recently been reconsidering the market failures approach while reviewing a new data set. Figure 1 charts CEO and other executive director earnings over the period 2000–2020. Figure 2 charts the ratio CEO total earnings to UK average annual earnings over the same period.
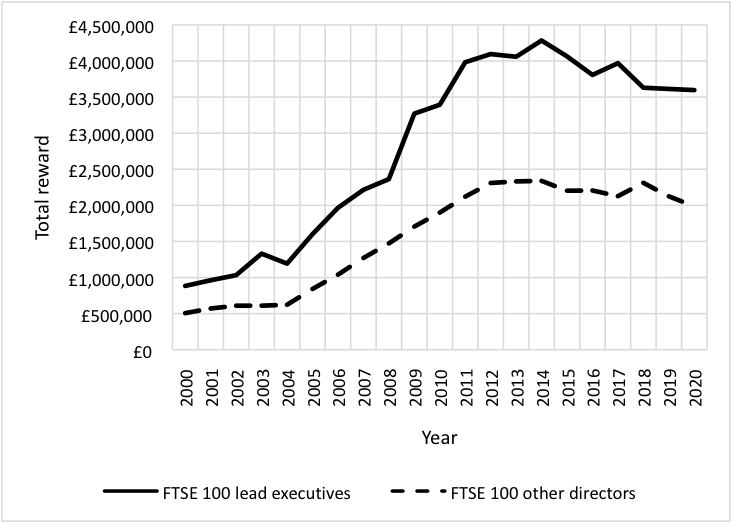
Between 2000 and 2014 FTSE 100 CEO median total earnings increased from £884,000 to £4,284,000, an average annual increase of around 11%. During the same period average earnings grew from £15,800 in 2000 to £22,069, an annualised increase of about 2.5%. For comparison, the annualised increase in the retail prices index over the same period was 2.8%.
The ratio of CEO earnings to average earnings increased from 54:1 in 2000 to 177:1 in 2014. The reason why CEO pay increased so much more rapidly than average earnings can partly be explained by the LTIP valuation problem. Average earnings predominantly reflect payments made in cash, hence the close relationship between the growth in average earnings and the headline rate of inflation.
A significant proportion of CEO pay, however, is delivered in discounted shares. The underlying financial instrument takes the form of a call option which tracks share price increases and ignores decreases. The strongest correlation is with annual increases in the FTSE 100 share price index, ignoring the years in which the index falls.
You can see from the charts that, after 2014 when CEO pay peaks, something interesting happens—the curve flattens. CEO pay actually declined from £4,064,000 in 2015 to £3,597,000 in 2020. During the same period average earnings continued to grow by around 2.75% per year, from £22,436 in 2015 to £25,780 in 2020. As a result the ratio of CEO pay to average earnings reduced from 177:1 to 127:1 in 2020.
Greater transparency and disclosure
Why this change has occurred is of significant interest.
Solutions to market failures typically involve action by governments—for example, high taxation or mandatory pay caps. However, successive governments in the UK have chosen instead to place the onus on investors to address the issue of high executive pay by enforcing greater transparency and enhanced disclosure.
The data suggests that this is beginning to work. Before 2015 large institutional investors seemed reluctant to take a position on executive pay. Since then many have actively engaged with companies on the subject. In January 2017 newspapers reported that BlackRock was demanding cuts to executive pay and bonuses in companies in which they were invested. In 2016 LGIM published a position paper called Mind the Gap, followed by Principles of Executive Pay in 2020. In April 2017 NBIM, on behalf of the Norwegian sovereign wealth fund, published a thoroughly researched position paper which urged companies to move towards simpler and more robust remuneration models. BlackRock issued a further statement on the role of public company shareholders in moderating excess pay in April 2019.
Investors are, in effect, being encouraged to solve the collective action problem.
A second important development has been a growing trend to replace LTIPS with restricted shares. In 2018, The Weir Group succeeded in introducing a restricted share plan to replace its LTIP in entirety. The new programme removed the complex performance conditions which had previously applied. The quid pro quo was a substantial reduction in the size of the award and an extended period over which the restricted shares vest.
In September 2020 The Purposeful Company Steering Group reported that institutional investors were increasingly supporting new arrangements which involve eliminating LTIPs entirely and replacing them with restricted stock with a face value of at most 50% of the value of LTIP awards.
It is still early days, but I am beginning to wonder if the tiger of executive pay inflation has at last been taken by its tail.
* Principal data sources: Income Data Services, for 2000-2015. CIPD Executive Pay in the FTSE 100 annual reviews for 2016–20.
Sandy Pepper is professor of management practice at the London School of Economics.
Related Posts
-
July 1, 2021

Researchers have interviewed non-executive directors and investors to highlight the hidden factors involved in CEO pay decisions.
-
March 13, 2024

‘High equity-based pay should be an outcome, not an input,’ according to London School of Economics professor.
-
April 20, 2022

PwC research looking at FTSE 100 remuneration reports reveals most sectors are seeing pay levels return to pre-Covid levels.
-
December 1, 2021

Linking KPIs to sustainability targets results in complexity. A focus on corporate purpose is a better way to tackle climate change.